Though powerful, AT&T Research’s open source graph visualization tool suite might lean too heavily into geek territory to have captured the interest of the visually-inclined OmniGraffle-ish crowd. Nevertheless, Graphviz and the surprisingly simple DOT language it uses makes it possible for creative types to generate attractive and visually consistent graphs by spending only a few minutes listing objects and their relationships. Graphviz will do the rest, laying out the graph according to magical and undoubtedly geeky algorithms. Sounds fun, doesn’t it?
DOT is easy to learn. The syntax is simple and straightforward. But wait: syntax? I want to make a site diagram. Why use some plain text graph description language like DOT?
Don’t get me wrong. As a designer, I love visual tools. OmniGraffle is awesome, and I use it often (especially when applying Jesse James Garrett’s IA Visual Vocabulary). But I love trying old things for new things, and the idea of typing in some labels and relationships and then having a graph generated for me based on my pre-defined (visual) parameters, seems fantastic. Since most of our basic/simple site diagrams use the same style, pushing boxes around the screen isn’t always the best use of my time. Plus, I love plain text (highly portable, as is Graphviz, which runs on Linux, Windows and Mac OS X) and I love the separation of content and layout which Graphviz provides.
Let’s take a look at a very simple site diagram, which I’ve generated using Graphviz:
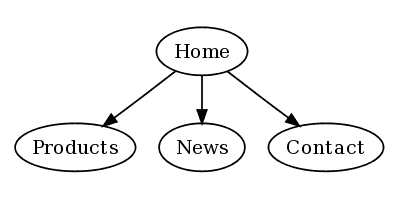
This was created using the following code:
digraph test {
    home [label = "Home"];
    prod [label = "Products"];
    news [label = "News"];
    cont [label = "Contact"];

    home -> {prod news cont}
}
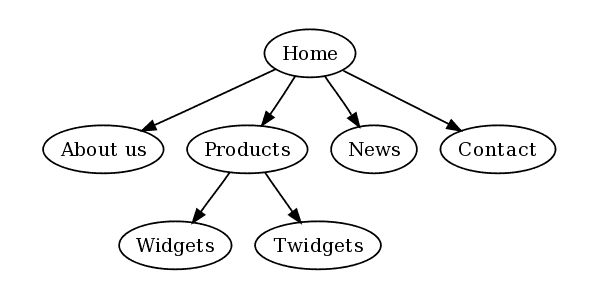
Of course, I could’ve opened OmniGraffle, dragged a box, copied it several times, changed the labels, dragged some arrows from box to box, selected them all and clicked an Align button. But, what if the client adds some new items, or new relationships between items, or both? It’s back to box-pushing. Let’s continue with my first example. Now, my very demanding client has added a few things, which force me to change the diagram. Since I’m using Graphviz, I don’t have to think about the layout, only the items and relationships:
digraph test {
    home [label = "Home"];
    about [label = "About us"];
    prod [label = "Products"];
        wid [label = "Widgets"];
        twd [label = "Twidgets"];
    news [label = "News"];
    cont [label = "Contact"];

    home -> {about prod news cont}
    prod -> {wid twd}
}
Done. From these changes, Graphviz generates the following image:
In a visual layout application, I would’ve had to move things around myself. I would have to consider all relationships, and try and figure out how to best visualize them. Granted, this is not the most complex example. The exciting thing about a tool like Graphviz is that it handles relationships objectively (algorithmically). This will not always produce the very best or most aesthetically logical graphs, but it can help one to look at these relationships in new ways. And if all is clearly communicated and looks nice, nothing’s lacking. Plus, even default settings make for great-looking graphs.
We can tweak the settings a bit to get the graph looking a bit nicer:
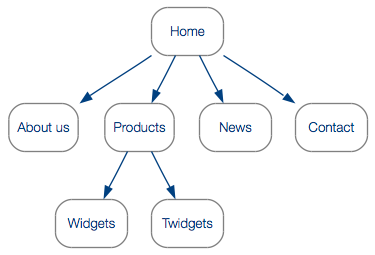
You can get pretty wicked with your styles; there are tons of possible parameters to set, and advanced users can add their own shapes. Transparency is also supported. Since Graphviz is essentially a command-line tool, you can send other processes to it to automate the creation of graphs.
What are you waiting for?
To get started on your own Graphviz adventures you’ll need some tools:
- A plain text editor (I’m a Vim-lover, and have been happily using MacVim for a while).
- Graphviz for your system
If you’re interested in a high-level tutorial, let me know in the comments. If enough people want one, I’ll post a walkthrough of the DOT syntax and how to style graphs. For the impatient, a few minutes in Google should yield some decent resources.
Enjoy!
Just thought I’d mention that OmniGraffle also does automatic graph layout: if you pop open the Outliner drawer, you can enter your nodes in the outline and watch them get automatically positioned on the canvas.
Not to disparage Graphviz’s graph layout in any way–in fact, OmniGraffle 5 (currently in beta) uses Graphviz behind the scenes to do its graph layout! I just wanted to make sure you knew about the automatic layout options in OmniGraffle (since you mentioned pushing boxes by hand).
Thanks, Ken. I am aware of OmniGraffle’s automatic layout, and have used it on occasion. One of the things I like about Graphviz is the quick creation of multiple hierarchies in plain text, as opposed to the single hierarchy imposed by an outline. Using my example in the post, let’s say I wanted to connect the “Home” node directly to the “Widgets” node, but keeping the rest of the relationships the same. In Graphviz, I would simply add “wid” to the Home relationships array. Is it possible to do this in the outline in OmniGraffle (perhaps OmniGraffle 5)?
As mentioned, I often use OmniGraffle– my compliments on a great application.
Just looking at random Graphviz related posts and thought you might be interested in this: http://www.hokstad.com/making-graphviz-output-pretty-with-xsl.html – it’s a post with links to an XSL stylesheet I put together to do additional styling (drop shadows and gradients) to the Graphviz SVG output.
It’s quite simple to extent to do other automated changes to the Graphviz output.
(I’m also an OmniGraffle fan, btw., but like you I don’t want to drag boxes around all the time, but when I do OmniGraffle is the only diagramming tool I’ve ever been reasonably happy with)
@Vidar Nice work!
Hi,
I tried out Graphviz software and I have a question regarding the output display format.
For eg: From node x to node y if there are 5 links (x->y) Graphviz draws five separate links instead of one link with edge weight =5.
Is there any way to get this done automatically? How do I compute edge weights in Graphviz?
Thanks.
@Tanya: I’m not enough of a hardcore Graphviz user to know if what you’d like to do is possible. For my purposes, using your example, I actually would prefer 5 separate links.
Maybe an expert user could help youI think I saw you post a question in a Graphviz forum.